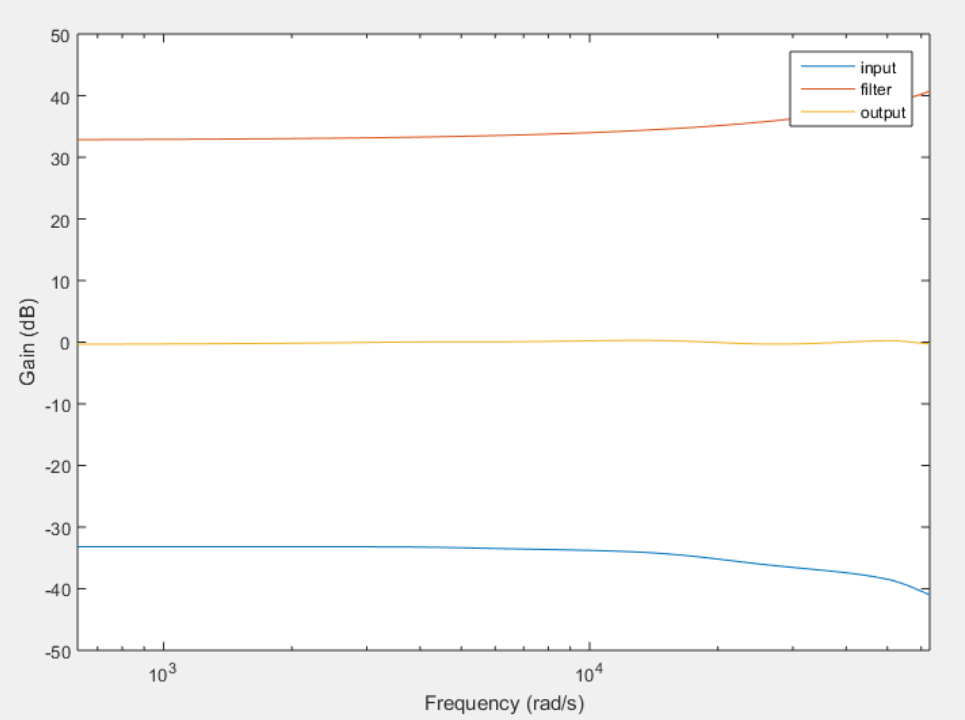
Before testing our MATLAB optimization on audiograms, we validated the individual parts of the algorithm, including the bandpass filter function we created and the method of combining frequency response graphs against circuit simulations in CircuitLab. After this validation process, we tested the entire script on audiogram samples.
The following figures show the optimization script's ability to compensate for various types of hearing loss, including sensineural, conductive, and mixed. In all of these cases, the algorithm performs well and is able to bring the output hearing to a normal range of -20 dB - 10. However, for the mixed hearing loss, there is a small dip below -20 dB at roughly 15000 rad/s. This indicates that we may need an additional bandpass filter in the higher frequency regions or higher gain capabilities.


No comments:
Post a Comment