 |
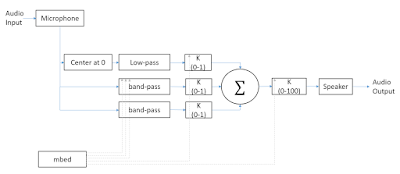
| Figure 1: Functional Block Diagram of circuit for prototype 1 |
In order to determine the optimal filter and gain values for the circuit in Figure 1, we created a MATLAB script that performed frequency response analysis of our circuit and utilized a non linear least squared optimizer. A functional block diagram of the optimization script is shown in Figure 2.
 |
| Figure 2: Functional Block Diagram |
The cost function used for the non linear optimization combines the frequency response magnitude curves of each of the parallel band pass filters and the original sound signal. The optimal function y = 0 represents an ideal frequency response, which is a decibel gain of 0. This signifies no deviation in amplitude from the original sound.
The non linear optimization function, in this case the MATLAB function lsqnonlin, attempts to minimize the difference between the ideal function and the filter circuit by varying the desired parameters of the filter resistors and gains. The function then outputs the variables found by the optimization.
The band pass filters were modeled using the following transfer function model for an MFB bandpass filter:
Each resistor value, R1, R2, and R3, was varied during the optimization.


No comments:
Post a Comment